

- A role that can open analytics: Global Admin, Workspace Admin or Contacts Manager. Content Editors do not have access because analytics summarize lead data.
- A published funnel that has had some visitors. See Share your funnel.
Important to note
Open your analytics
1
Open the funnel's Analytics tab
From your Funnels page, click the funnel, then click Analytics in the tabs at the top of the page.
2
Choose a date range
Pick Today, Yesterday, Last 7 days, Last 28 days or Last 90 days. Click More… for This quarter, Year to date or Custom range. With Custom range, pick a start and end date (up to about a year). The page opens on Last 7 days.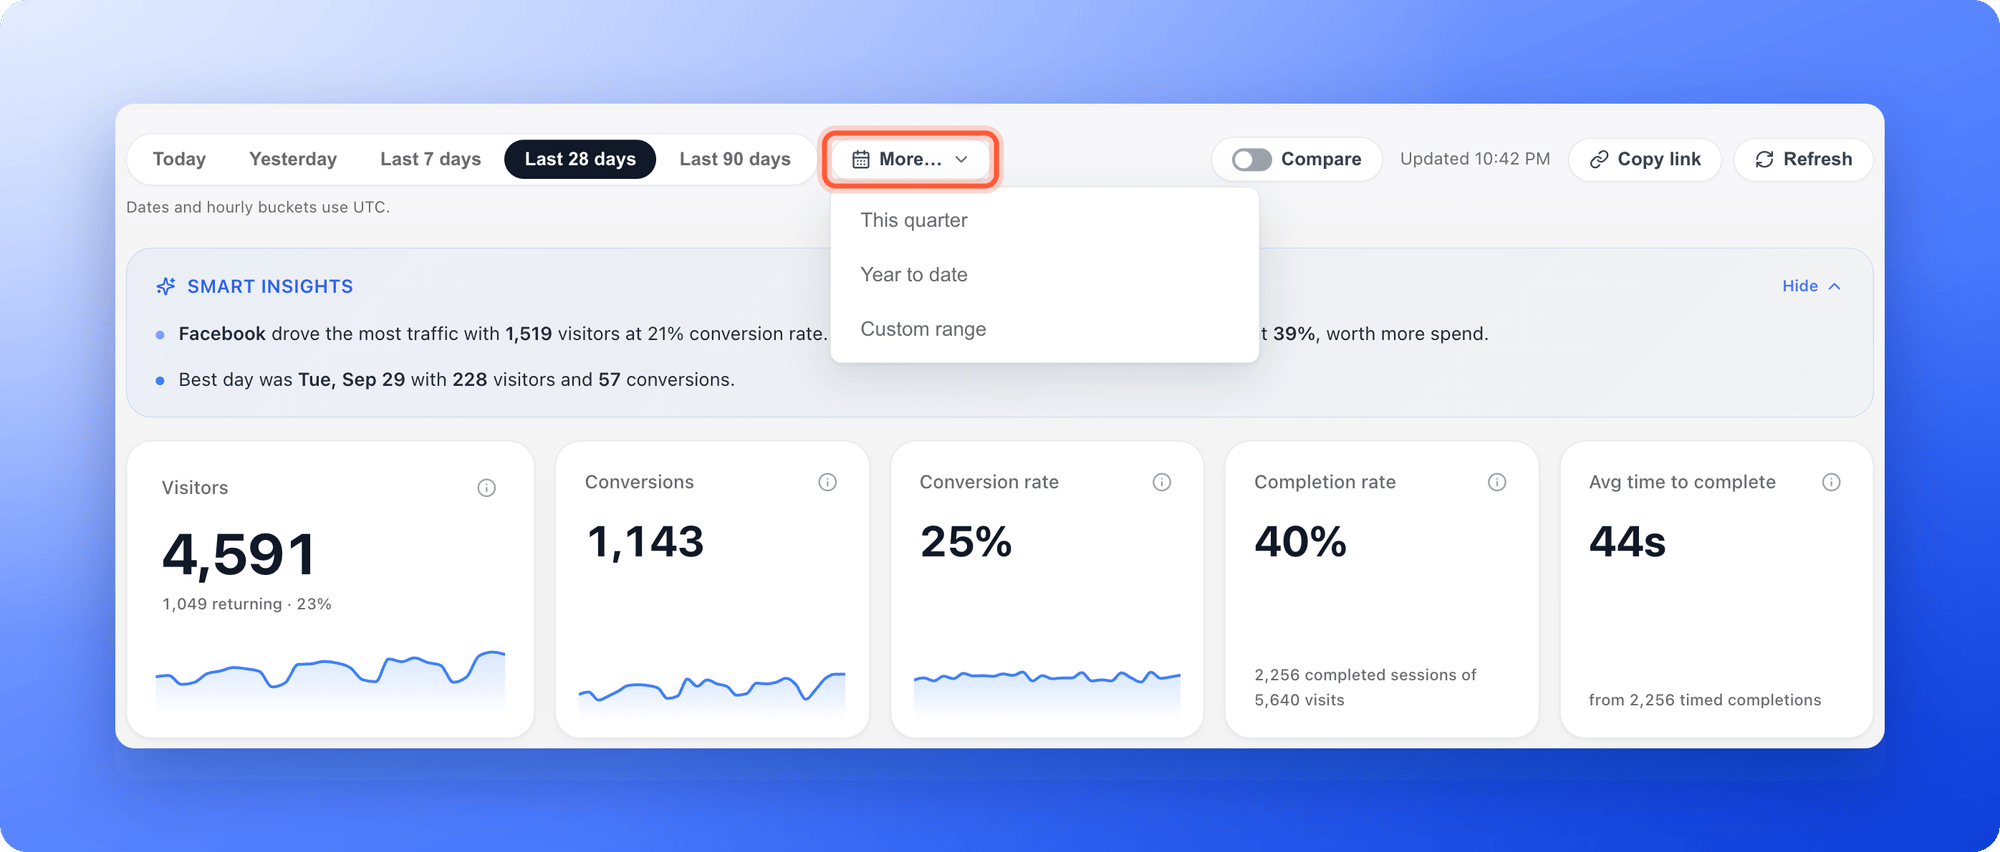
3
Compare with the previous period (optional)
Turn on Compare to measure this period against the period of the same length just before it. Every card then shows the change.
Find where visitors leave
Open Step reach and compare neighboring bars. A big drop between two steps points to a question that is too long, too personal or unclear. Each bar counts how often a step was recorded, so use the chart as a guide rather than an exact headcount. Step reach needs detailed tracking. If it says No step data yet, open your funnel’s settings, go to Cookies & Consent and set Analytics tracking depth to a Detailed option. See Cookies and consent.Mark events on your chart
Global Admins and Workspace Admins can pin a marker for a campaign launch, a release, an incident, an experiment or a note. In Visitors and conversions, click the plus icon (Add chart annotation), choose a Date, a Type and a Label, then click “Pin marker”. The marker shows on the chart so you can see how an event changed your traffic.The five numbers at the top
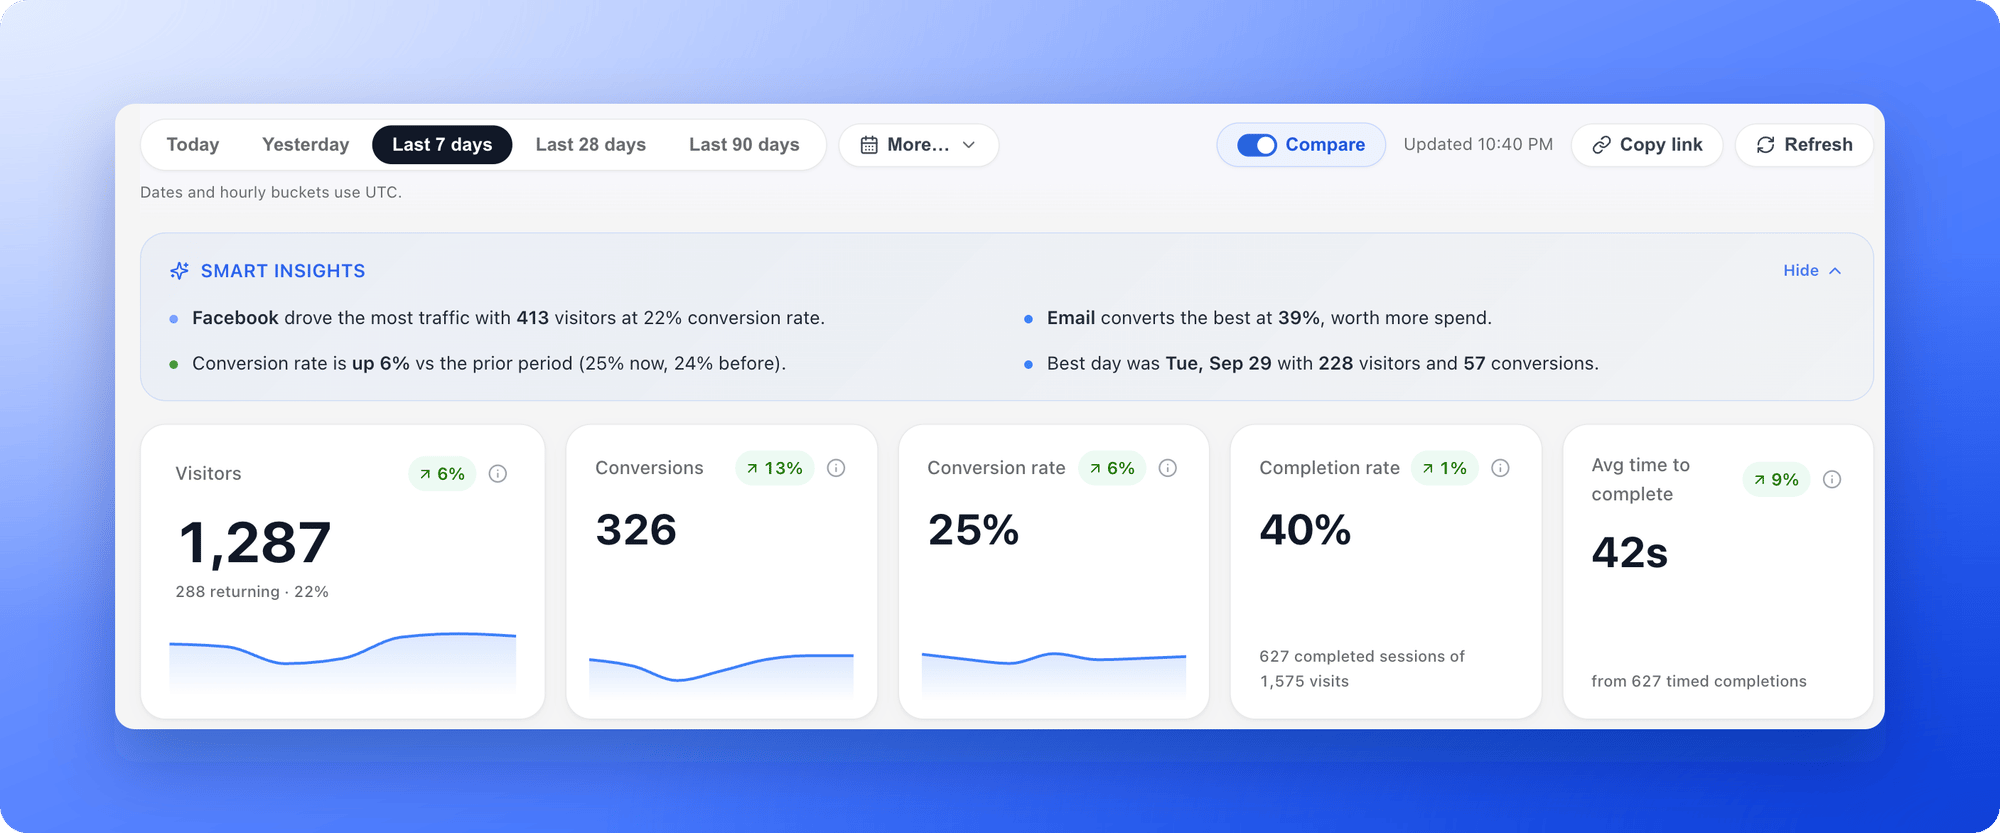
- Visitors: the sum of daily unique visitors. A person who comes back on another day counts again on that day. A line under the number shows how many were returning visitors.
- Conversions: the total number of form submissions in the date range.
- Conversion rate: tracked submissions divided by the sum of daily unique visitors. In plain words, the share of visitors who become leads.
- Completion rate: completed sessions divided by all visits in the range.
- Avg time to complete: the average time from a visitor’s first page load to reaching the success page. It is capped at 24 hours so an abandoned tab does not skew it.
The charts below
- Visitors and conversions: daily unique visitors and conversions over your date range.
- Step reach: how many times each step of your funnel was reached, in order, including the contact form and the success page.
- Top traffic sources: where visitors come from, ranked by volume, with the conversion rate for each. Use Group traffic sources by to switch between By source, By medium, By campaign, By referrer, By country and By browser language.
- Activity by time of day: when visitors are most active, in UTC hours. Use it to time your launches and ad spend.
- Device split: the share of Mobile, Desktop, Tablet and other devices.
- Top step responses: what people picked on each question.
- Lead pipeline: the current status of the leads created in your date range.
Your conversion rate on the Funnels page
The CVR column on your Funnels page shows each funnel’s conversion rate over its whole life, for example 12.00% when 12 of 100 visitors became leads.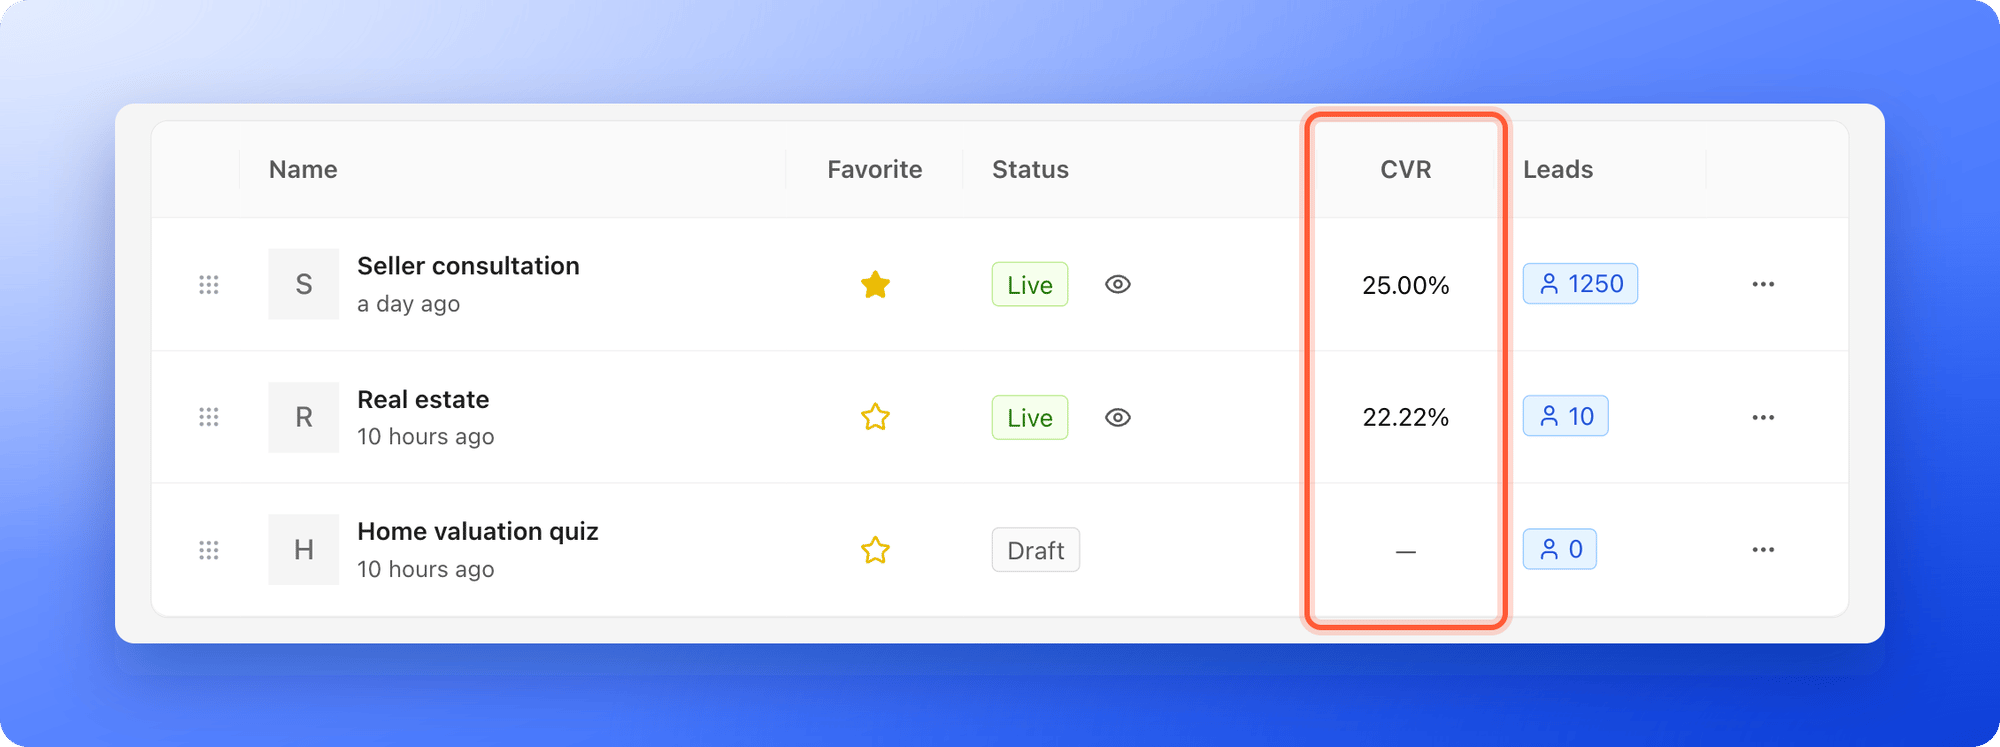
Troubleshooting
Top traffic sources is empty
Top traffic sources is empty
Tag the links you use in ads and emails with UTM parameters (short tags that show where a visit came from), for example utm_source, utm_medium and utm_campaign. Until you do, try By referrer or By country to see other breakdowns.
My numbers are different from the Leads tab
My numbers are different from the Leads tab
Analytics uses UTC days and counts a returning visitor once per day. The Leads table uses your local time and does not include locked leads.
What to do next
See where a lead came from
Open a lead’s Tracking tab for their source and device.
Download your analytics as CSV
Get the numbers behind any chart as a file.
Track your ads
Connect a pixel to see which ads bring leads.
Set up cookies and consent
Choose how much visitor activity AskFunnel tracks.