

- A role that can open analytics: Global Admin, Workspace Admin or Contacts Manager.
- A funnel with analytics data. See Read your funnel analytics.
Download a chart’s data
1
Choose your date range
Open your funnel, click Analytics and pick the dates you want, for example Last 28 days or a Custom range. The file covers the range you have selected.
2
Click the download icon
Find the chart you want and click the download icon (Download as CSV) in the top right corner of its card. The file downloads to your computer right away. The icon appears once a chart has data. If you do not see it, widen the date range.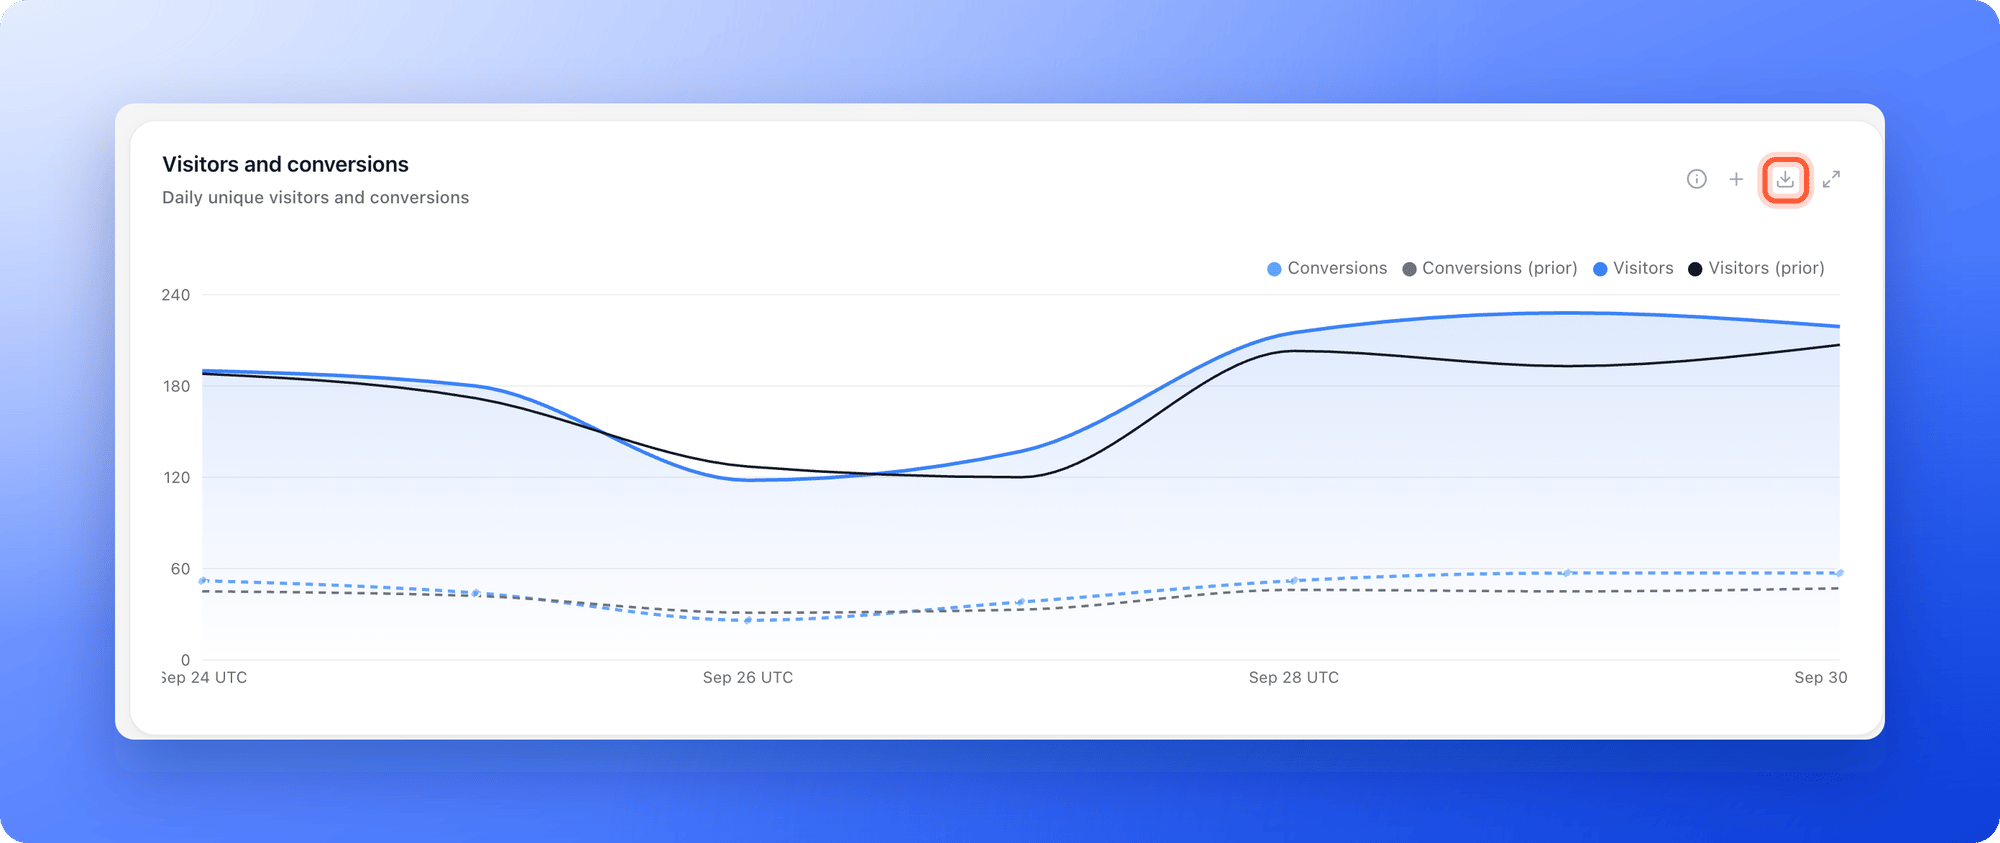
3
Open the file
Open the CSV (a simple spreadsheet file) in Excel, Google Sheets or any other tool.
These files hold totals, not individual leads. To download names, emails and answers, see Export your leads.
Which file you get
Each card downloads its own file, and the end of the file name tells you which card it came from.- Visitors and conversions (ends in
_visitors.csv): one row per day with visitors, conversions, completions and the conversion rate, plus a total row. - Step reach (
_dropoff.csv): how many times each step was reached. - Top traffic sources (
_sources.csv): visitors, conversions and conversion rate for the grouping you chose, such as source or campaign. - Activity by time of day (
_hours.csv): visits for each hour in UTC. - Device split (
_devices.csv): visits by device type. - Top step responses (
_responses.csv): how often each answer was picked. - Lead pipeline (
_pipeline.csv): how many of the leads created in your date range are in each status.
What to do next
Export your leads
Download names, emails and answers.
See how your funnel performs
Visitors, conversions and where people drop off.